China-EU - international trade in goods statistics
Eurostat
This article provides a picture of the international trade in goods between the European Union (EU) and China. It analyses the type of goods exchanged between the two economies and the shares of each EU Member State in those exchanges.
This article is part of an online publication providing recent statistics on international trade in goods, covering information on the EU's main partners, main goods traded, specific characteristics of trade as well as background information.
Recent developments
The COVID-19 crisis caused both exports and imports between the EU and China to fall in 2020, as shown in Figure 1. Imports reached a minimum of € 24.7 billion in March 2020. By December 2021 they had recovered to € 47.9 billion. Exports reached a minimum of € 14.9 billion in March 2020. By December 2021 they had recovered to € 17.9 billion.

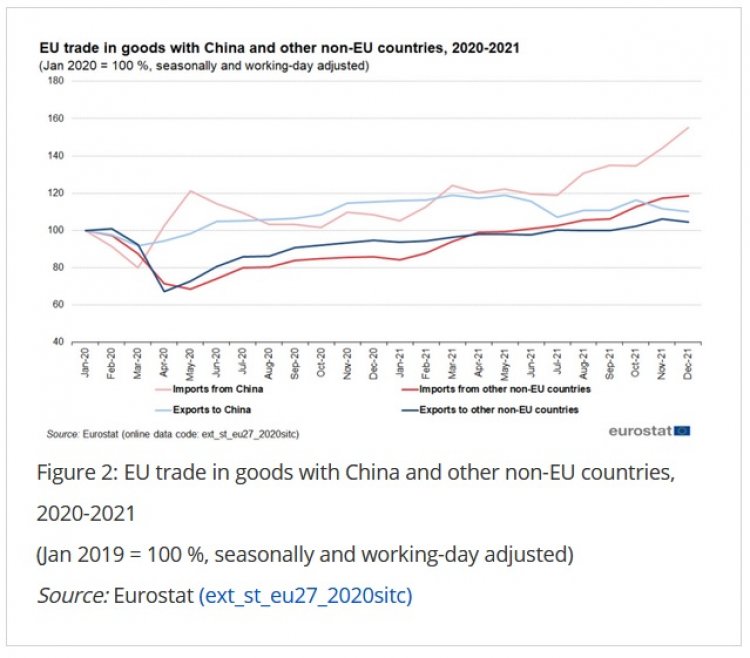
Figure 2 compares EU trade with China to EU trade with other non-EU countries. Between January 2020 and December 2021, EU imports from China increased by 55.2 % while imports from other non-EU countries increased by 18.6 %. EU exports to China increased by 9.9 % while exports to other non-EU countries increased by 4.4 %.
EU and China in world trade in goods
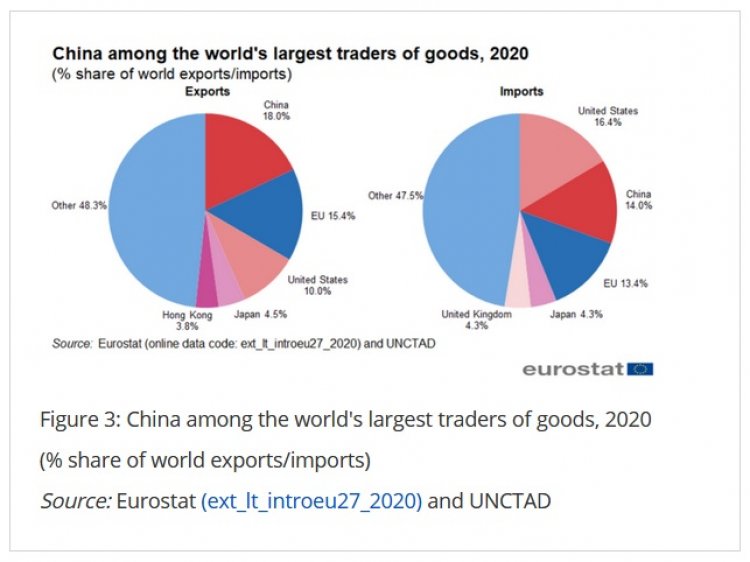
Figure 3 shows the world's largest traders of goods. China (€ 2 268 billion, 18.0 %) was the largest exporter in the world, followed by the EU (€ 1 933 billion, 15.4 %), the United States (€ 1 253 billion, 10.0 %), Japan (€ 561 billion, 4.5 %) and Hong Kong (€ 480 billion, 3.8 %). China (€ 1 801 Billion, 14.0 %) was the second largest importer in the world, preceded by the United States (€ 2 108 billion, 16.4 %) and followed by the EU (€ 1 717 billion, 13.4 %), Japan (€ 556 billion, 4.3 %) and the United Kingdom (€ 556 billion, 4.3 %).
The imports and exports of goods for the EU and China indexed at 100 in 2010 for the period to 2020 are shown in Figure 4. It also shows the cover ratio (exports / imports) for this period. Exports from the EU were lowest in 2010 (100) and highest in 2019 (149) and were 135 in 2020. Imports to the EU were lowest in 2010 (100) and highest in 2019 (132) and were 117 in 2020. The cover ratio for the EU was lowest in 2011 (97 %) and highest in 2016 (116 %) and was 113 % in 2020. Exports from China were lowest in 2010 (100) and highest in 2020 (164). Imports to China were lowest in 2010 (100) and highest in 2018 (153) and were 147 in 2020. The cover ratio for China was lowest in 2011 (109 %) and highest in 2015 (135 %) and was 126 % in 2020.

Both exports to and imports from China increased between 2011 and 2021.
The position of China among the largest trade partners of the EU in 2021 can be seen in Figure 5. In 2021, China was the third largest partner for EU exports of goods (10.2 %). It was preceded by the United States (18.3 %) and the United Kingdom (13.0 %) and followed by Switzerland (7.2 %) and Russia (4.1 %). It was the largest partner for EU imports of goods (22.4 %), followed by the United States (11.0 %), Russia (7.5 %), the United Kingdom (6.9 %) and Switzerland (5.9 %).

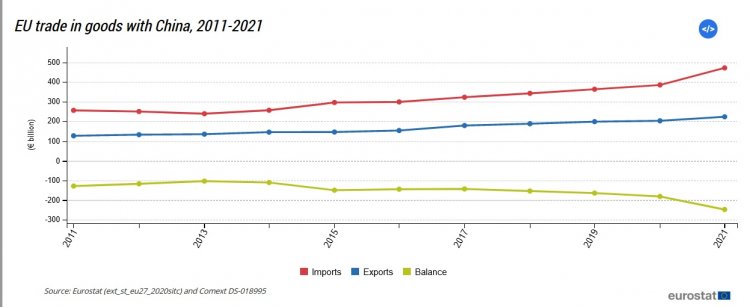
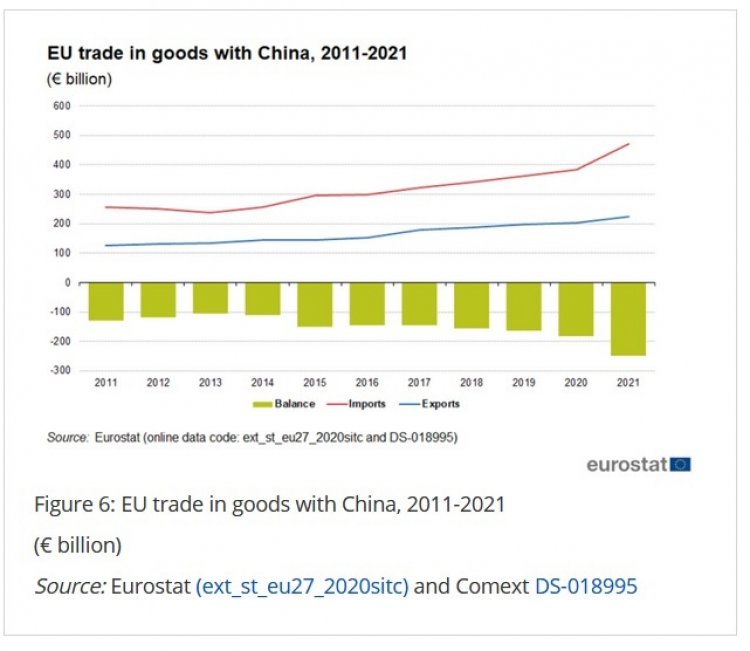
Figure 6 shows the exports, imports and trade balance between the EU and China from 2011 to 2021. In 2011, the EU had a trade deficit with China of € 129 billion. The trade deficit remained throughout the whole period, reaching € 249 billion in 2021. Both exports to and imports from China increased between 2011 and 2021. EU exports to China were highest in 2021 (€ 223 billion) and lowest in 2011 (€ 127 billion). EU imports from China were highest in 2021 (€ 472 billion) and lowest in 2013 (€ 239 billion).
EU-China trade by type of goods
The breakdown of EU trade with China by SITC groups is shown in Figure 7. The red shades denote the primary goods: food & drink, raw materials and energy, while the blue shades show the manufactured goods: chemicals, machinery & vehicles and other manufactured goods. Finally, other goods are shown in green. In 2021, EU exports of manufactured goods (86 %) had a higher share than primary goods (12 %). The most exported manufactured goods were machinery & vehicles (52 %), followed by other manufactured goods (20 %) and chemicals (15 %). In 2021, EU imports of manufactured goods (98 %) also had a higher share than primary goods (2 %). The most imported manufactured goods were machinery & vehicles (56 %), followed by other manufactured goods (35 %) and chemicals (7 %).
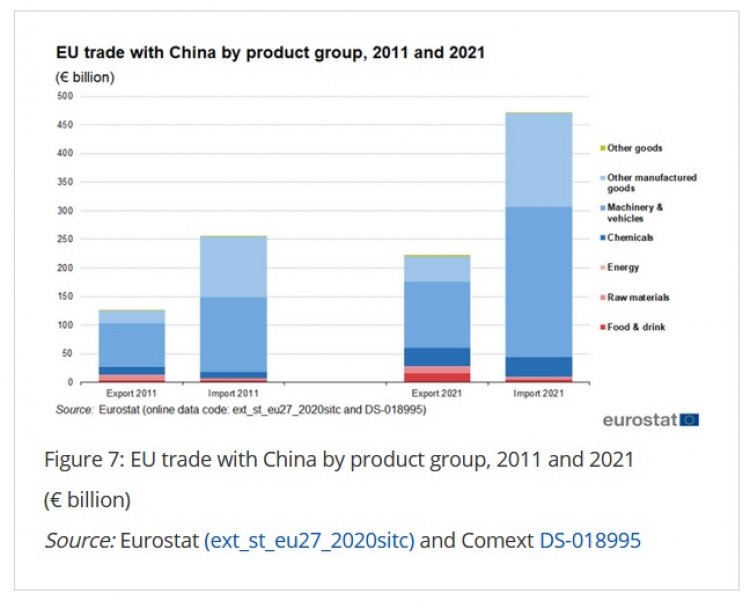
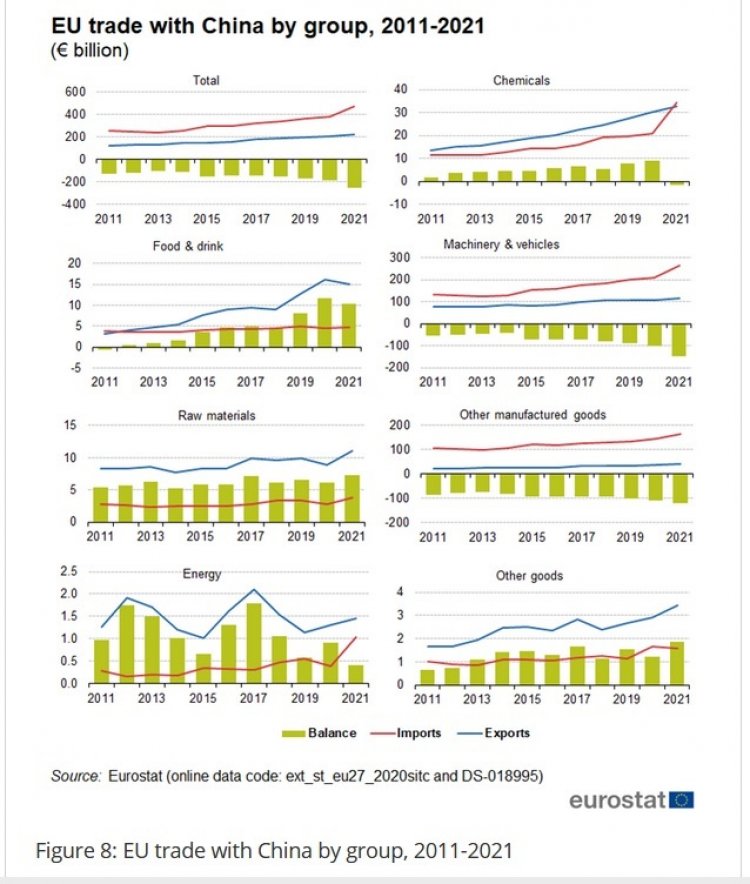
Figure 8 shows the evolution of EU imports and exports by SITC group since 2011. In 2021, the EU had trade surpluses in food & drink (€ 10.4 billion), raw materials (€ 7.3 billion), other goods (€ 1.9 billion) and energy (€ 0.4 billion). The EU had trade deficits in chemicals (€ 1.6 billion), other manufactured goods (€ 120.0 billion) and machinery & vehicles (€ 147.3 billion).
(€ billion)
Source: Eurostat (ext_st_eu27_2020sitc) and Comext DS-018995
EU-China most traded goods
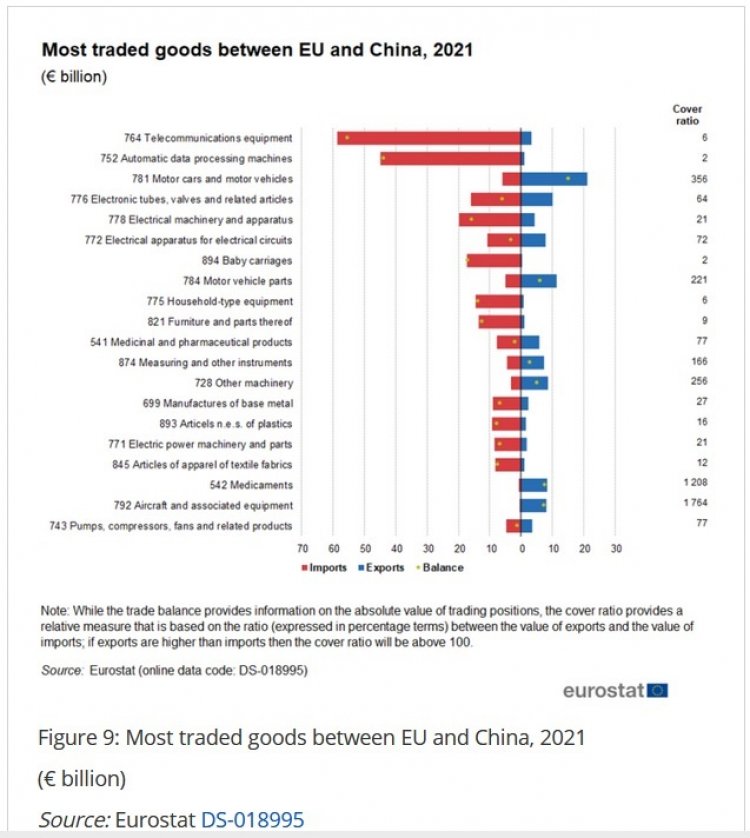
More detail about the goods exchanged between the EU and China is given in Figure 9, showing the 20 most traded goods at SITC-3 level. These top 20 goods covered 63 % of total trade in goods in 2021. Twelve belonged to machinery and vehicles, six to other manufactured goods and two to chemicals. The most traded group of goods at this level was telecommunications equipment. Another interesting way to look at the data is to investigate the cover ratio (exports / imports) of traded goods, showing the direction of the trade flows between the two economies. These ratios can be found in the right-hand margin of Figure 9. Ten products were below 50 %, indicating EU imports from China were more than twice as large as EU exports to China. Five products were above 200 %, indicating EU exports to China were more than twice as large as EU imports from China. Five products were between 50 % and 200 %, showing more balanced trade.
Trade with China by Member State
Table 1a shows the imports of goods from China by Member State. The three largest importers from China in the EU were the Netherlands (€ 110 420 million), Germany (€ 98 031 million) and France (€ 40 744 million). Czechia (39.4 %) had the highest share for China in its extra-EU imports.
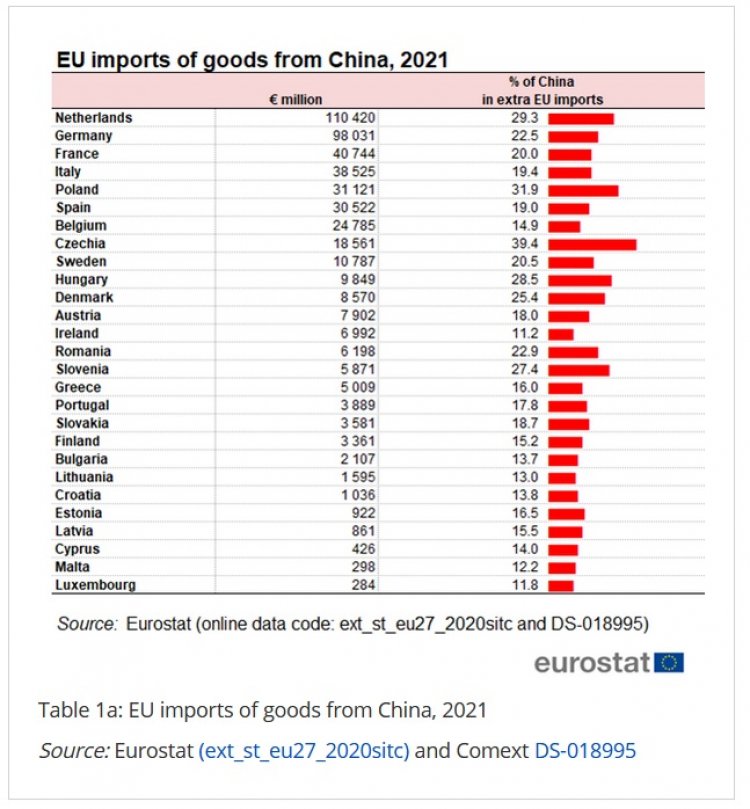
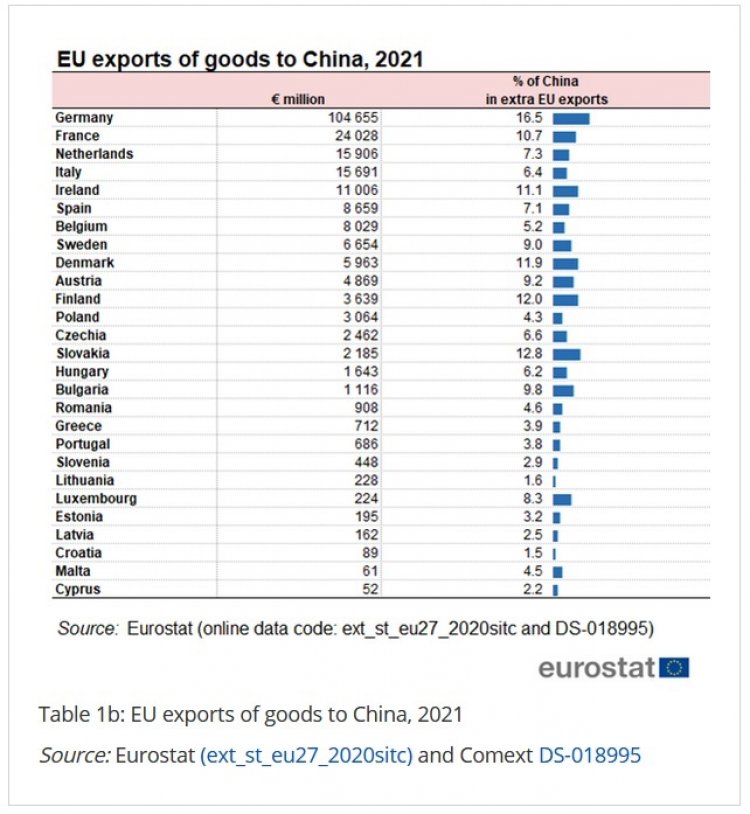
Table 1b shows the exports of goods to China by Member State. The three largest exporters to China in the EU were Germany (€ 104 655 million), France (€ 24 028 million) and the Netherlands (€ 15 906 million). Germany (16.5 %) had the highest share for China in its extra-EU exports.
The trade in goods balance between the EU Member States and China is shown in Table 1c. It shows that three Member States had a trade surplus with China. The largest surplus was held by Germany (€ 6 624 million), followed by Ireland (€ 4 014 million) and Finland (€ 277 million). There were 24 Member States that had a trade deficit with China. The largest deficit was held by the Netherlands (€ 94 514 million), followed by Poland (€ 28 057 million) and Italy (€ 22 834 million).

Source data for tables and graphs
Data sources
EU data is taken from Eurostat's COMEXT database. COMEXT is the reference database for international trade in goods. It provides access not only to both recent and historical data from the EU Member States but also to statistics of a significant number of third countries. International trade aggregated and detailed statistics disseminated via the Eurostat website are compiled from COMEXT data according to a monthly process.
Data are collected by the competent national authorities of the Member States and compiled according to a harmonised methodology established by EU regulations before transmission to Eurostat. For extra-EU trade, the statistical information is mainly provided by the traders on the basis of customs declarations.
EU data are compiled according to EU guidelines and may, therefore, differ from national data published by the Member States. Statistics on extra-EU trade are calculated as the sum of trade of each of the 27 EU Member States with countries outside the EU. In other words, the EU is considered as a single trading entity and trade flows are measured into and out of the area, but not within it.
The United Kingdom is considered as an extra-EU partner country for the EU-27 for the whole period covered by this article. However, the United Kingdom was still part of the internal market until the end of the transitory period (31 December 2020), meaning that data on trade with the United Kingdom are still based on statistical concepts applicable to trade between the EU Member States. Consequently, while imports from any other extra-EU-27 trade partner are grouped by country of origin, the United Kingdom data reflect the country of consignment. In practice this means that the goods imported by the EU-27 from the United Kingdom were physically transported from the United Kingdom but part of these goods could have been of other origin than the United Kingdom. For this reason, data on trade with the United Kingdom are not fully comparable with data on trade with other extra-EU-27 trade partners.
Data for the non EU-27 countries used in Figures 1-3 are taken from the UNCTAD database of the United Nations. For the calculation of shares, the world trade is defined as the sum of EU trade with non-EU countries (source: Eurostat) plus the international trade of non-EU countries (source: UNCTAD).
Methodology
According to the EU concepts and definitions, extra-EU trade statistics (trade between EU Member States and non-EU countries) do not record exchanges involving goods in transit, placed in a customs warehouse or given temporary admission (for trade fairs, temporary exhibitions, tests, etc.). This is known as ‘special trade’. The partner is the country of final destination of the goods for exports and the country of origin for imports.
Product classification
Information on commodities exported and imported is presented according to the Standard international trade classification (SITC). A full description is available from Eurostat’s classification server RAMON.
Unit of measure
Trade values are expressed in millions or billions (109) of euros. They correspond to the statistical value, i.e. to the amount which would be invoiced in the event of sale or purchase at the national border of the reporting country. It is called a FOB value (free on board) for exports and a CIF value (cost, insurance, freight) for imports.
Context
Trade is an important indicator of Europe’s prosperity and place in the world. The bloc is deeply integrated into global markets both for the products it sources and the exports it sells. The EU trade policy is one of the main pillars of the EU’s relations with the rest of the world.
Because the 27 EU Member States share a single market and a single external border, they also have a single trade policy. EU Member States speak and negotiate collectively, both in the World Trade Organization, where the rules of international trade are agreed and enforced, and with individual trading partners. This common policy enables them to speak with one voice in trade negotiations, maximising their impact in such negotiations. This is even more important in a globalised world in which economies tend to cluster together in regional groups.
The openness of the EU’s trade regime has meant that the EU is the biggest player on the global trading scene and remains a good region to do business with. Thanks to the ease of modern transport and communications, it is now easier to produce, buy and sell goods around the world which gives European companies of every size the potential to trade outside Europe.


